

28: On The Probability of Collision
How we might leverage a data-driven analysis of aircraft separation for improving safety in critical airspace.

030000Z FEB 25
Greetings,
This week's issue comes with news of two separate aviation tragedies. On January 29, 2025, American Airlines flight 5342, a regional jet, collided with an Army helicopter above the Potomac River while on approach to Reagan National Airport. Days later, on the night of January 31, a medical transport jet crashed in a residential neighborhood shortly after takeoff from Philadelphia International Airport.
Given that investigations into both incidents are ongoing, it would be premature to speculate about specific causes. Instead, as both an aviation enthusiast and software engineer, I'll share my perspective on how we might analyze aviation systems to identify potential safety improvements.
The immediate concern in the flight 5342 incident is aircraft separation. While the sky is vast and aircraft are typically separated by miles, the risk of encounters increases dramatically near airports. Flight paths converge like funnels toward these common points, with the runway threshold - the beginning of the landing surface - being the most critical convergence point.
To visualize this, let's create a three-dimensional plot. We'll place the runway threshold at the origin (0,0,0) of our coordinate system, with the X-axis aligned with the runway centerline extending away from the threshold. This allows us to analyze the spatial relationships between approaching aircraft and other traffic in the vicinity.

The plot above shows runway 15/33 at Reagan National Airport. The black rectangle represent the 1,586m long by 46m wide runway, drawn to scale. We're examining the airspace within approximately 10km of the runway.

To highlight the critical area where aircraft must converge, we've added a red box at the runway threshold. This point represents the narrow window through which every landing aircraft must pass.

Viewing the approach corridor in three dimensions reveals how aircraft descend along a relatively confined path. While we don't have access to complete transponder data for all flights, we can simulate typical approach patterns with realistic variations to understand the spatial constraints.

The blue lines represent multiple simulated approach paths, showing how aircraft naturally cluster around the ideal approach path while maintaining some operational variance. This clustering becomes more pronounced closer to the runway threshold, where precision is crucial.

From the overhead view, we can observe how the approach corridor narrows as aircraft near the runway. Preliminary reports indicate the collision with flight 5342 occurred approximately 0.8km from the runway - a point where approach paths are already quite constrained.
To understand the potential conflict point, we've added simulated helicopter flight paths (shown in red) representing the reported route of the Army Black Hawk. These paths cross the approach corridor at a slight angle, following VFR flight path 4 outside Reagan National.
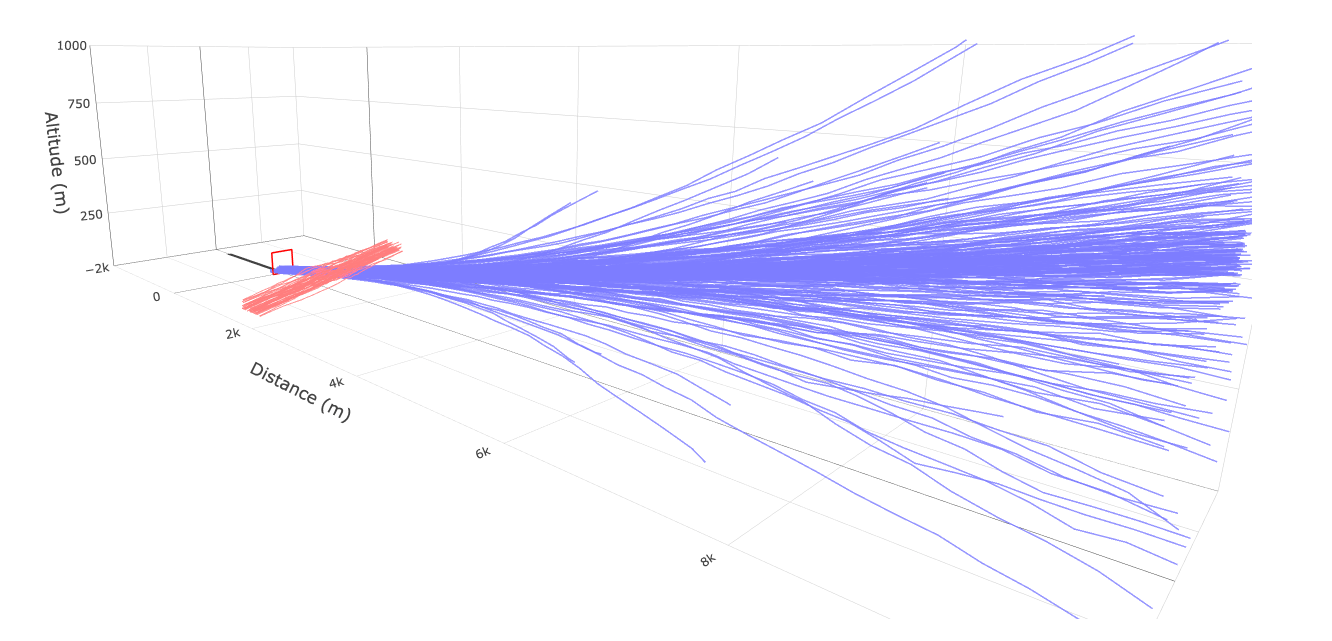
What's particularly concerning is the proximity of these designated flight paths. The three-dimensional perspective reveals minimal separation between the corridors, suggesting that even small deviations from intended routes could result in potential conflicts.

This analysis, while using simulated data, highlights a critical aspect of aviation safety: the intersection of flight paths near airports deserves particular scrutiny. With access to actual transponder and position data, we could develop more precise probability density models to quantify the risk at these intersections. Such analysis could identify areas where the probability of aircraft proximity exceeds acceptable thresholds.
This methodology could be expanded to examine complex airspace throughout the nation. By identifying intersections with elevated risk, aviation authorities could proactively evaluate and adjust flight paths, potentially preventing future incidents.
While this analysis cannot determine the cause of recent events, it suggests ways we might work to prevent similar incidents in the future. —✈
PS- For those interested in the technical details, the Javascipt code used to generate these visualizations is available on GitHub or can be seen as an html file directly below. The code includes the full implementation of the flight path simulations and probability density calculations discussed in this analysis.
<!DOCTYPE html>
<html>
  <head>
    <meta charset="utf-8" />
    <title>DCA Runway - 15/33 Approach Corridor</title>
    <script src="https://cdn.plot.ly/plotly-2.16.1.min.js"></script>
  </head>
  <body>
    <div id="rwyPlot" style="width: 1600px; height: 900px; border: 1px solid #ccc"></div>
    <div style="margin-top: 10px">
      <button id="btn-approach">Approach View</button>
      <button id="btn-overhead">Overhead View</button>
      <button id="btn-toggle-approach-corridor">Toggle Approach Corridor</button>
      <button id="btn-toggle-crossing-corridor">Toggle Crossing Corridor</button>
    </div>

    <script>
      const xRunway = [
        [0, -1586],
        [0, -1586],
      ];
      const yRunway = [
        [-23, -23],
        [23, 23],
      ];
      const zRunway = [
        [0, 0],
        [0, 0],
      ];

      const runwayTrace = {
        x: xRunway,
        y: yRunway,
        z: zRunway,
        type: "surface",
        colorscale: [["0", "#333333"], ["1", "#333333"]],
        showscale: false,
        showlegend: false,
        opacity: 1,
        name: "Runway",
      };

      const thresholdTrace = {
        x: [0, 0, 0, 0, 0],
        y: [-100, 100, 100, -100, -100],
        z: [0, 0, 100, 100, 0],
        mode: "lines",
        line: { color: "red", width: 3 },
        type: "scatter3d",
      };

      const N_PATHS = 250;
      const N_CROSSING_PATHS = 50;
      const POINTS_PER_PATH = 40;
      const GLIDESLOPE_ANGLE = 3 * (Math.PI / 180);
      const MAX_DISTANCE = 10000;

      function createNoise(amplitude) {
        const noiseArray = [];
        let value = 0;
        for (let i = 0; i < POINTS_PER_PATH; i++) {
          value += (Math.random() - 0.5) * amplitude;
          value *= 0.95;
          noiseArray.push(value);
        }
        return noiseArray;
      }

      const allTraces = [runwayTrace, thresholdTrace];
      const approachCorridorIndices = [];
      const crossingCorridorIndices = [];

      for (let i = 0; i < N_PATHS; i++) {
        const angle = (i / N_PATHS) * Math.PI * 2;
        const radius = Math.pow(Math.random(), 2);
        const startLateralOffset = Math.sin(angle) * radius * 100;
        const startVerticalOffset = Math.cos(angle) * radius * 200 + 100;
        const angleVariation = (Math.random() * 2 - 1) * 5 * radius;
        const endLateralOffset = Math.sin(angle) * radius * 2000;
        const endVerticalOffset = Math.random() * 25 * Math.pow(Math.random(), 2) + 10;
        const endXOffset = -Math.random() * 100;
        const lateralNoise = createNoise(100);
        const verticalNoise = createNoise(20);

        let xPath = [],
          yPath = [],
          zPath = [];
        let zeroHeightCount = 0,
          positiveXCount = 0;

        for (let j = 0; j < POINTS_PER_PATH; j++) {
          const progress = j / (POINTS_PER_PATH - 1);
          const dist = -100 + progress * (MAX_DISTANCE + 100);
          const curveFactor = Math.pow(progress, 1.8);
          const lateralOffset = startLateralOffset * (1 - curveFactor) + endLateralOffset * curveFactor;
          const effectiveGlideslope = GLIDESLOPE_ANGLE + (angleVariation * (Math.PI / 180)) * curveFactor;
          const noiseScale = curveFactor;
          const currentLateralPos = lateralOffset + lateralNoise[j] * noiseScale;
          const nominalHeight = Math.tan(effectiveGlideslope) * (dist + endXOffset * (1 - curveFactor));

          const minHeight = Math.min(40, 5 + Math.abs(dist) / 100);
          const currentVerticalPos = Math.max(
            minHeight,
            nominalHeight + (startVerticalOffset * curveFactor + endVerticalOffset * (1 - curveFactor)) + verticalNoise[j] * noiseScale
          );

          xPath.push(dist);
          yPath.push(currentLateralPos);
          zPath.push(currentVerticalPos);

          if (currentVerticalPos === 0) zeroHeightCount++;
          else if (currentVerticalPos > 0) positiveXCount++;
        }

        if (xPath.length > 2 && zeroHeightCount / positiveXCount < 0.2) {
          allTraces.push({
            x: xPath,
            y: yPath,
            z: zPath,
            mode: "lines",
            line: { color: "rgba(100, 100, 255, 0.8)", width: 3 },
            type: "scatter3d",
            showlegend: false,
            hoverinfo: "none",
            visible: true,
          });
          approachCorridorIndices.push(allTraces.length - 1);
        }
      }

      for (let i = 0; i < N_CROSSING_PATHS; i++) {
        const heightOffset = 60 + Math.pow(Math.random(), 2) * 40;
        const xOffset = (Math.random() * 2 - 1) * 200;
        const lateralNoise = createNoise(20);
        const verticalNoise = createNoise(10);
        let xPath = [],
          yPath = [],
          zPath = [];

        for (let j = 0; j < POINTS_PER_PATH; j++) {
          const progress = j / (POINTS_PER_PATH - 1);
          const yPos = 1000 - progress * 2000;
          const xPos = 500 + xOffset + progress * 1500;
          const noiseScale = Math.sin(progress * Math.PI);
          const currentLateralPos = yPos + lateralNoise[j] * noiseScale;
          const currentHeight = Math.max(50, heightOffset + verticalNoise[j] * noiseScale);

          xPath.push(xPos);
          yPath.push(currentLateralPos);
          zPath.push(currentHeight);
        }

        allTraces.push({
          x: xPath,
          y: yPath,
          z: zPath,
          mode: "lines",
          line: { color: "rgba(255, 100, 100, 0.8)", width: 2 },
          type: "scatter3d",
          showlegend: false,
          hoverinfo: "none",
          visible: true,
        });
        crossingCorridorIndices.push(allTraces.length - 1);
      }

      const layout = {
        showlegend: false,
        font: { size: 14 },
        scene: {
          aspectmode: "manual",
          aspectratio: { x: 4, y: 1, z: 1 },
          camera: {
            eye: { x: 3, y: -3, z: 1 },
            center: { x: 0, y: 0, z: 0 },
            up: { x: 0, y: 0, z: 1 },
          },
          xaxis: {
            title: { text: "Distance (m)" },
            range: [-2000, MAX_DISTANCE],
            tickfont: { size: 12 },
          },
          yaxis: { title: "", range: [-1000, 1000], showticklabels: false },
          zaxis: {
            title: "Altitude (m)",
            range: [0, 1000],
            tickvals: [250, 500, 750, 1000],
            tickfont: { size: 12 },
          },
        },
      };

      const cameraPresets = {
        approach: {
          'scene.camera': {
            eye: { x: 3, y: -3, z: 1 },
            center: { x: 0, y: 0, z: 0 },
            up: { x: 0, y: 0, z: 1 }
          },
          'scene.aspectmode': 'manual',
          'scene.zaxis.showgrid': true,
          'scene.zaxis.showline': true,
          'scene.zaxis.showticklabels': true,
          'scene.zaxis.title.text': 'Altitude (m)'
        },
        overhead: {
          'scene.camera': {
            eye: { x: 0, y: 0, z: 3 },
            center: { x: 0, y: 0, z: 0 },
            up: { x: 0, y: 1, z: 0 }
          },
          'scene.aspectmode': 'manual',
          'scene.zaxis.showgrid': false,
          'scene.zaxis.showline': false,
          'scene.zaxis.showticklabels': false,
          'scene.zaxis.title.text': ''
        }
      };

      Plotly.newPlot("rwyPlot", allTraces, layout).then(() => {
        rwyPlot.on("plotly_relayout", (eventdata) => {
          const camera = eventdata["scene.camera"];
          if (camera) {
            console.log(camera);
          }
        });
      });

      document.getElementById("btn-approach").addEventListener("click", () => {
        Plotly.relayout("rwyPlot", cameraPresets.approach);
      });

      document.getElementById("btn-overhead").addEventListener("click", () => {
        Plotly.relayout("rwyPlot", cameraPresets.overhead);
      });

      document.getElementById("btn-toggle-approach-corridor").addEventListener("click", () => {
        const update = { visible: !allTraces[approachCorridorIndices[0]].visible };
        Plotly.restyle("rwyPlot", update, approachCorridorIndices);
      });

      document.getElementById("btn-toggle-crossing-corridor").addEventListener("click", () => {
        const update = { visible: !allTraces[crossingCorridorIndices[0]].visible };
        Plotly.restyle("rwyPlot", update, crossingCorridorIndices);
      });
    </script>
  </body>
</html>
✈
Thank you for reading.
Flightlines will be back next week with more insights and updates from the world of commercial aviation.
Until then, safe travels and happy flying!
Fascinating as usual. The danger of the flight path convergence is so obvious. No matter what the cause of the Regan incident, the convergence provided the opportunity for any accident do close to the airport. The Philadelphia accident has to be mechanical issues. What is the detailed process for inspections? Was the pilot blameless?
Thanks
Chip Newhart
Excellent work! Your visualizations and descriptions make this problem and a path forward (no pun intended) perfectly clear. I hope news sources and ultimately, the folks in charge of re-evaluating flight paths that clearly increase the likelihood of incidents, will find and use the resource you've created here!